Getting Started#
This notebook gets you started with a brief nDCG evaluation with LensKit for Python.
This notebook is also available on Google Collaboratory and nbviewer.
Setup#
We first import the LensKit components we need:
from lenskit.als import BiasedMFScorer
from lenskit.batch import recommend
from lenskit.data import ItemListCollection, UserIDKey, load_movielens
from lenskit.knn import ItemKNNScorer
from lenskit.metrics import NDCG, RBP, RecipRank, RunAnalysis
from lenskit.pipeline import topn_pipeline
from lenskit.splitting import SampleFrac, crossfold_users
And Pandas is very useful, as is Seaborn for plotting:
import matplotlib.pyplot as plt
import seaborn as sns
The pyprojroot package makes it easy to find input data:
from pyprojroot.here import here
Loading Data#
We’re going to use the ML-100K data set:
ml100k = load_movielens(here("data/ml-100k.zip"))
ml100k.interaction_table(format="pandas", original_ids=True).head()
| user_id | item_id | rating | timestamp | |
|---|---|---|---|---|
| 0 | 1 | 1 | 5.0 | 874965758 |
| 1 | 1 | 2 | 3.0 | 876893171 |
| 2 | 1 | 3 | 4.0 | 878542960 |
| 3 | 1 | 4 | 3.0 | 876893119 |
| 4 | 1 | 5 | 3.0 | 889751712 |
Defining Recommenders#
Let’s set up two scoring models:
model_ii = ItemKNNScorer(k=20)
model_als = BiasedMFScorer(features=50)
For each of these, we also need to make a :ref:pipeline <pipeline>:
pipe_ii = topn_pipeline(model_ii)
pipe_als = topn_pipeline(model_als)
Running the Evaluation#
In LensKit, our evaluation proceeds in 2 steps:
Generate recommendations
Measure them
If memory is a concern, we can measure while generating, but we will not do that for now.
Let’s start by creating and collecting the recommendations; we will generate 100 recommendations per user, and will collect all of them into a single ItemListCollection:
# test data is organized by user
all_test = ItemListCollection(UserIDKey)
# recommendations will be organized by model and user ID
all_recs = ItemListCollection(["model", "user_id"])

for split in crossfold_users(ml100k, 5, SampleFrac(0.2)):
    # collect the test data
    all_test.add_from(split.test)

    # train the pipeline, cloning first so a fresh pipeline for each split
    fit_als = pipe_als.clone()
    fit_als.train(split.train)
    # generate recs
    als_recs = recommend(fit_als, split.test.keys(), 100)
    all_recs.add_from(als_recs, model="ALS")

    # do the same for item-item
    fit_ii = pipe_ii.clone()
    fit_ii.train(split.train)
    ii_recs = recommend(fit_ii, split.test.keys(), 100)
    all_recs.add_from(ii_recs, model="II")
/Users/mde48/LensKit/lkpy/lenskit/lenskit/als/_explicit.py:59: UserWarning: Sparse CSR tensor support is in beta state. If you miss a functionality in the sparse tensor support, please submit a feature request to https://github.com/pytorch/pytorch/issues. (Triggered internally at /Users/runner/miniforge3/conda-bld/libtorch_1733624403138/work/aten/src/ATen/SparseCsrTensorImpl.cpp:55.)
  rmat = rmat.to_sparse_csr()
Measuring Recommendations#
We analyze our recommendation lists with a RunAnalysis and some metrics.
ran = RunAnalysis()
ran.add_metric(NDCG())
ran.add_metric(RBP())
ran.add_metric(RecipRank())
results = ran.compute(all_recs, all_test)
Now we have nDCG values, along with some other metrics! We can start computing and plotting.
results.list_metrics().groupby("model").mean()
| NDCG | RBP | RecipRank | |
|---|---|---|---|
| model | |||
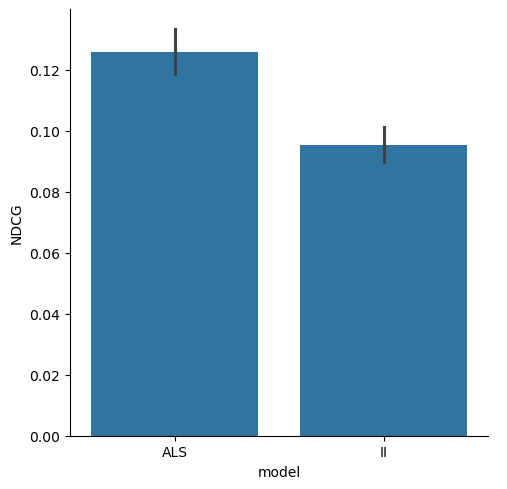
| ALS | 0.125894 | 0.088839 | 0.19244 |
| II | 0.095334 | 0.036945 | 0.10837 |
sns.catplot(results.list_metrics().reset_index(), x="model", y="NDCG", kind="bar")
plt.show()